Debug Printing
31 Jan 2014
I still haven't quite caught up with all the stuff I wanted to write about back in August, but at some point when I started to write little userspace programs that wrote stuff to the screen, I thought my kernel debug messages started to get in the way.
I'm still not ready to give up debug messages from the kernel, so the best alternative seemed to be to output them to something else, such as a serial port.
Writing to a serial port is rather easy, so there's no need for me to go into detail there. I made a few changes to my emulation setup, though, that made showing the debug messages a bit nicer.
Tmux
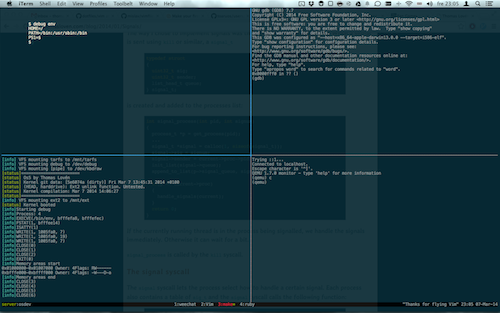
I've described how I use tmux with qemu, gdb and telnet before. It was easy to add another pane which displays the debug information, but one thing at a time. Here's what I did in a bash script:
tmux split-window -h 'qemu-system-i386 -kernel build/kernel/kernel -initrd "build/tarfs.tar" -curses -monitor telnet:localhost:4444,server -s -S -serial file:serial.out'
This opens a new tmux pane with qemu running my kernel and loading
tarfs.tar as a multiboot module. The -monitor flag starts a telnet
server for controlling the emulator. -s starts a gdb server at tcp
port 1234 and -S makes the emulator wait for a command before it
starts running the kernel. Finally, the -serial flag saves all output
from serial port 1 to a file.
The next step is:
tmux split-window -v 'tail -f serial.out | util/colorize.sh'
which opens up another tmux pane that displays the serial output using
the auto-updating feature of tail. The script colorize.sh colorizes
certain words of the output:
#!/usr/bin/env bash

C_NO=`echo -e "\\033[0m"`
C_RED=`echo -e "\\033[31m"`
C_GREEN=`echo -e "\\033[32m"`
C_YELLOW=`echo -e "\\033[33m"`
C_BLUE=`echo -e "\\033[36m"`

while read line; do
    echo $line | sed \
        -e "s/\(\[info\]\)/${C_BLUE}\1$[C_NO}/" \
        -e "s/\(\[status\]\)/${C_GREEN}\1$[C_NO}/" \
        -e "s/\(\[warning\]\)/${C_YELLOW}\1$[C_NO}/" \
        -e "s/\(\[error\]\)/${C_RED}\1$[C_NO}/"
done
Next is
tmux select-pane -L
tmux split-window -v 'i586-elf-gdb'
tmux select-pane -U
telnet localhost 4444
Which opens a new pane for the gdb debugger and then moves back to the
first pane to open the telnet terminal.
Git
Notice the yellow lines in that screenshot? The ones that say
Kernel git data: [5e6074a (dirty)] Fri Mar 7 13:45:31 2014 +0100
(HEAD, harddrive): Ext2 unlink function. Untested.
Kernel compilation: Mar 7 2014 14:06:27
The data for this is stored in a special file called version.c
#include <version.h>

char * __kernel_git_hash = GITHASH;
char * __kernel_git_date = GITDATE;
int __kernel_git_dirty = GITDIRTY;
char * __kernel_git_message = GITMESSAGE;
char * __kernel_git_branch = GITBRANCH;

char * __kernel_build_date = __DATE__;
char * __kernel_build_time = __TIME__;
which has a special line in the kernel makefile:
version.o: CFLAGS += -DGITHASH='$(shell git log -1 --pretty="tformat:%h")' \
    -DGITDATE='$(shell git log -1 --pretty="tformat:%cd")' \
    -DGITDIRTY='$(shell [[ -n `git status -s 2> /dev/null` ]] && echo 1 || echo 0)' \
    -DGITMESSATE='$(shell git log -1 --pretty="tformat:%s")' \
    -DGITBRANCH='$(shell git log -1 --pretty="tformat:%d")'
A few more lines makes sure version.c is always recompiled if any
other part of the kernel is:
kernel: $(kernel_objects)
    rm -f version.o
    $(MAKE) version.o
    $(LINK)
Obviously, this is a bit simplified. But not much. I might make a post about my makefiles some day...
But with this, I've kind of caught up. Neat! Back to programming ahead of myself!
